-
Bug
-
Resolution: Unresolved
-
 Major
Major
-
None
-
None
-
None
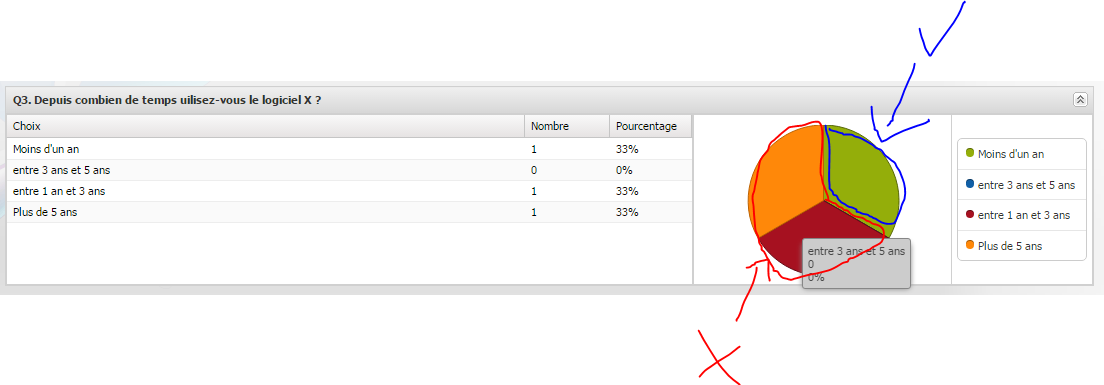
When there is at least one item with a number of '0', the tooltips over the pie chart are bugged.
In the picture below, the green zone is OK (it will show 'Moins d'un an 1 33%').
But the red and orange zones are bugged: while they are supposed to have a tooltip displaying 'entre 1 an et 3 ans 1 33%' and 'Plus de 5 ans 1 33%', they both have a tooltip displaying 'entre 3 ans et 5 ans 0 0%'.
It is an ExtJS bug (https://www.sencha.com/forum/showthread.php?304500-6.0.0-Charts-tooltip-are-wrong-with-a-0-data&p=1112770)
