I carried out the test on the ametys .org version 4.3.11 demo and on the client which is in version 4.3.12
How to reproduce
- in the online survey already available on the ametys demo create the following questions:
- a choice question with this text:
Question :Selon vous, quels étaient les objectifs ? (Vous pouvez cocher plusieurs cases)
Les choix :
La feuille de route de la collectivité
Un projet participatif
Un projet fédérateur
Un outil pour répondre au contexte de réforme territoriale (en 2010)
Faire progresser notre administration
Ne se prononce pas
Autre, précisez : - Question : De quelle(s) manière(s) vous êtes vous impliqué ? (Vous pouvez cocher plusieurs cases) *
Les choix : Participation à un ou plusieurs groupes projets
Participation à un groupe témoin (les réunions d’information sur les territoires)
Participation lors des ateliers des séminaires des cadres
Conduite d’un projet
Suivi pour information
Autre, précisez :
- a choice question with this text:
- From the front office respond to the survey
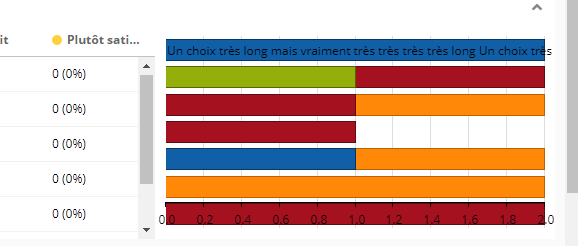
- Go see the statistics of the online survey
The graphics of the response results are not displayed correctly
- Conditionne
-
CGDROME-535 Loading...